
July 2023 Vol. 78 No. 7
Features
Breakthrough time of styrene emissions through various CIPP coating materials
Details from the Latest NASSCO Phase 3 Study
Dr. John Matthews, Director, and Quade Wells, Lab Manager | Trenchless Technology Center
(UI) — Recent studies of cured-in-place pipe (CIPP) liners have shown that potentially dangerous concentrations of styrene can be emitted prior to liner installation in the cold storage unit or vehicle. Although, the studies showed that the risks of styrene exposure can be easily mitigated, there is still a need to further enhance our understanding of CIPP emission characteristics to help create a cleaner and safer work environment and ensure public safety.
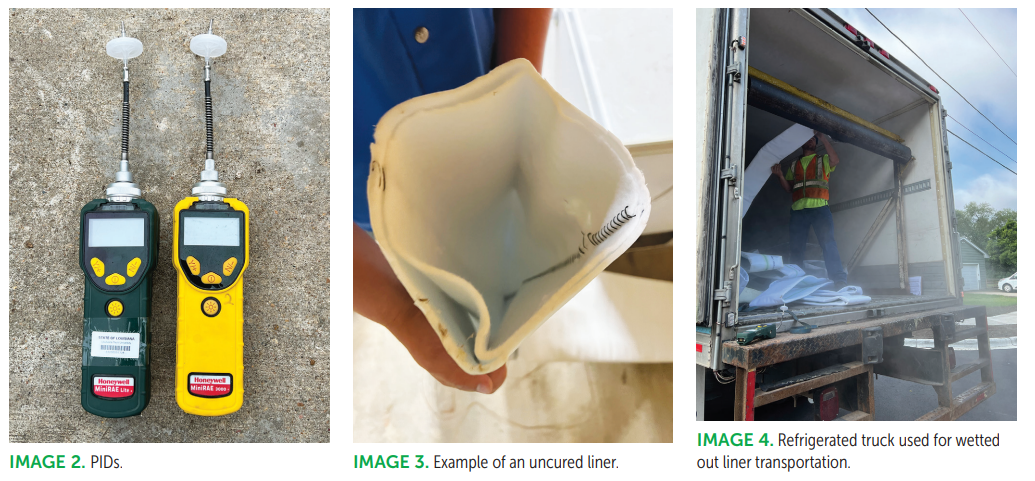
This article will highlight the steps taken through a recent study to better understand the characteristics of styrene emissions in the transport and storage of the liner in the refrigerated chamber. The study featured a secure testing chamber that utilized photoionization (PID) sensors to determine the levels of styrene released over a set amount of time for uncured liners with various types of coatings (PE, PU, PP, etc.).
The PID sensors sampled the rate of styrene in the enclosed area measured in parts per million. Information gathered in this study allowed for easier determination of safe styrene emission levels after being held in the refrigerated transport truck for various periods of time. Finally, field validation was performed using an actual transport truck containing various CIPP liners.
The goal of this study was to further increase knowledge and understanding of CIPP emissions characteristics. Furthermore, it was hoped to create a cleaner and safer environment for employees and the public.
These goals were accomplished through the following objectives:
- Study 1 – Lab Scale Study: The lab scale portion of the test featured a secure enclosed testing chamber that represents the refrigerated truck that liners are transported on to job sites. Several PID sensors were utilized in the testing to help determine the levels of styrene over various periods of time. Information gathered from this lab scale study test can be directly correlated to safe levels of styrene emission over a set period.
- Study 2 – Field Study: The field study was conducted to validate the results found from the lab scale study. The same PIDs used for the lab scale study were applied in the field to an installation operation. Here, we could see how the styrene emissions reacted in a real refrigerator transport truck and job site to make a more accurate determination of crew and public safety.
Lab scale study
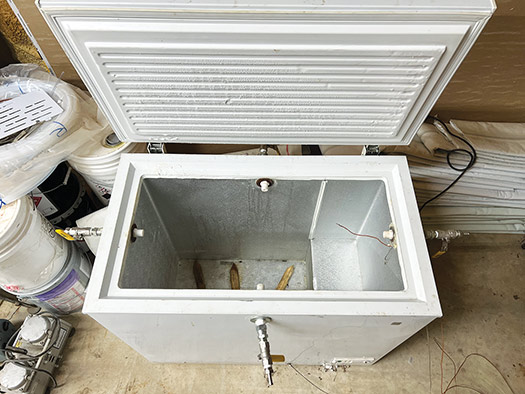
The first step taken in completion of the lab scale study was to create a testing chamber. The Trenchless Technology Center (TTC) modified a chest freezer to be the secure temperature-controlled testing chamber. It was fitted with four outlets where the styrene emissions could be recorded.
TTC wet-out all the liners in-house using various material coating liners, resin, rollers and vacuum pumps. Both ends of the liners were closed off using a nylon wrap and duct tape to ensure no styrene escaped from either end.
On completion of the wet-out process, the resin-impregnated, uncured liner was placed in the secure chamber. The goal was to compare the baseline VOC taken in the chamber prior to loading and compare it to the buildup of styrene levels over a set period. The actions taken simulate the uncured liners in the refrigerated transport truck prior to opening the doors at a construction site.
Field study
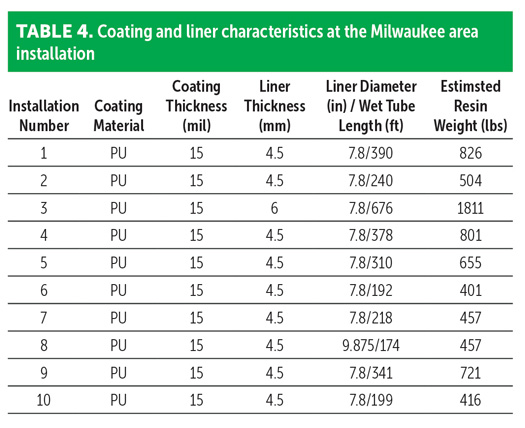
To perform the field study, researchers visited several liner installations for the purpose of monitoring the uncured liner transport truck. Modifications made to the refrigerated truck, to have PIDs onboard in the cab, consisted of drilling holes in the refrigerated area and running Teflon tubing to the PIDs that were safely secured at the passenger seat.
At each installation site, measurements of styrene emission were taken each time the doors opened to install a liner. Data was measured at the back of the truck from the ground and chest height at the middle and front of the chamber. Also noted was each time the door opened to load and unload the trash left over from the installation.
Lab results
The results of the lab scale study show the concentration of the measured styrene levels versus the amount of time. The three liners that had readings taken were: 15-millimeter thick polyurethane (PU), 17-millimeter thick polypropylene (PP), and 24-millimeter thick PU. Consistent styrene-to-volume ratios were used for all three tests.
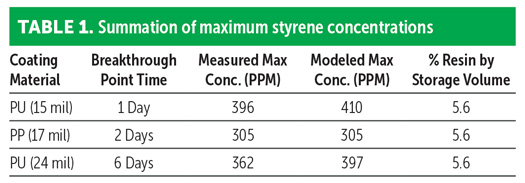
IMAGE 5 is an example of the styrene release over time and TABLE 1 summarizes the overall lab study results.
As expected, the thinner, 15- and 17-millimeter, liners allowed for a quicker breakthrough time, both being in the first two days. However, the 24-millimeter did not see any breakthrough until the sixth day of testing.
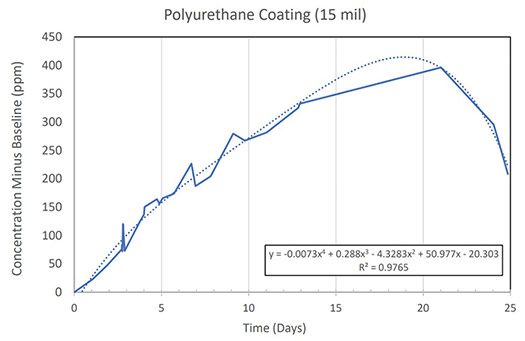
It should also be noted that the 24-millimeter liner never saw a decrease in concentration, whereas the other liners saw decreases after a peak was reached. It should be noted that styrene thresholds peaked between 350-400 parts per million. This measurement shows that there is an upper limit that was validated by the field study portion of the testing.
Field results
The following information summarizes the data collected from the two installation sites that were visited by TTC staff. Data shows the tracing of the breakthrough time after liners were loaded onto the reefers at the wet-out facility. For simplicity, one example installation is shown for Tampa, Fla.
Tampa, Fla. example installation
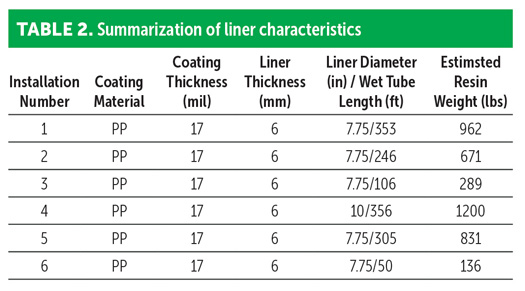
The following table logs the liner characteristics for each of the six installations that took place in Tampa. The truck that stored the liners measured 1,536 cubic feet.
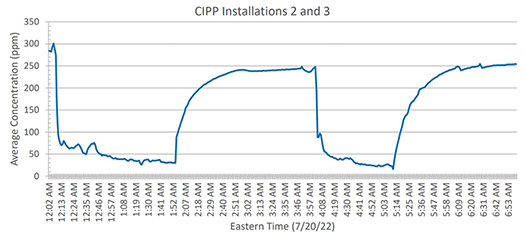
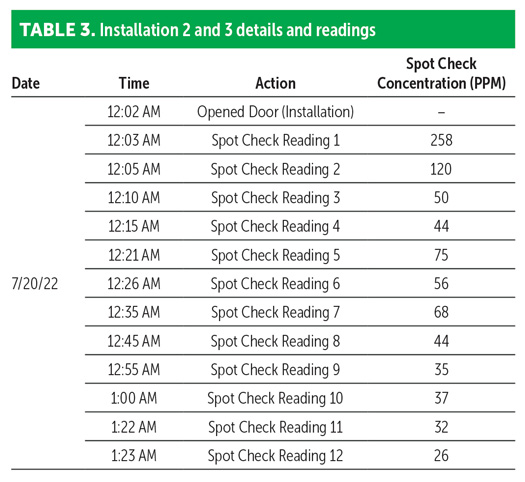
Installations 2 and 3 were performed on July 20, 2022, producing a similar trend to installation 1. IMAGE 6 illustrates the average concentration during the period in which installations 2 and 3 took place. TABLE 4 logs the readings taken when the doors of the truck were open and spot-checking readings that were measured from the tailgate of the truck during the installation.
The data presented above shows that the emission concentration dipped below 40 ppm while the doors were open for the installation – below the recommended exposure levels from OSHA and NIOSH. Once doors were closed, concentration increased to 250 ppm. The spot-check readings for installation 2 matched closely to the readings from inside the truck, while installation 3 spot-check readings were a bit lower than the truck values.
Milwaukee, Wisc. summary
The following table logs the liner characteristics for all 10 of the installations performed in the Milwaukee area. The truck that the liners were stored on measured 1,511 cubic feet.
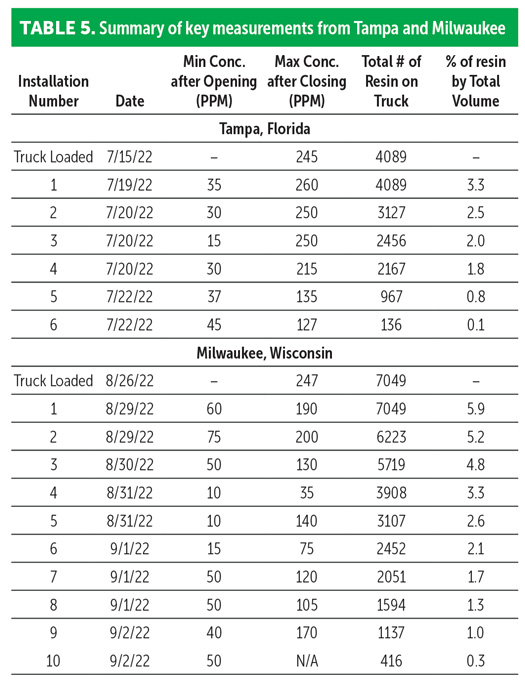
Depicted in TABLE 5, is a summarization of the key measurements taken from both Tampa and Milwaukee. The liners installed in Florida were a 17-millimeter PP coated liner, while the Wisconsin liners were 15-millimeter PU-coated.
In the field, with similar coatings and thickness, the breakthrough curve was steeper than what was found in the lab scale study, although the maximum concentrations measured in the field were similar or less than what was discovered in the lab.
Both field studies followed the same trend. As the doors were opened to perform the installation, the concentration would decrease. Once the doors were shut, there would be an increase until the concentration reached a peak and would then begin to decrease over time. Upon reviewing the data displayed in TABLE 5, as each liner was removed from the truck the concentration would decrease and continue to decrease over subsequent weeks.
Conclusion
The time to breakthrough is at least partially based on the materials used and the thickness of those materials. For the same material of different thicknesses (i.e., PU at 15 millimeters vs 24 millimeters) the thinner liner allowed breakthrough to happen sooner. Once the door of the cold storage or transport vehicle was opened, emissions levels dropped very quickly to below OSHA and NIOSH recommended levels.
For the two different contractors who were followed, the data showed that over the course of a week of installations, the styrene levels slowly reduced each day after liners were removed. Although that may seem intuitive, there is still residual styrene in the storage trucks to be aware of, even after all liners have been removed.
In the field, for similar coatings and thickness, breakthrough concentrations increased more quickly than what was observed in the freezer test, even for similar percent resin to total storage volume values. This could have been due to the difference in conditions between the field and lab.
Although maximum concentrations in the field were similar or less than what was observed in the lab, replicating breakthrough curves in the lab that were similar to the field was not achieved. Some spot-check readings at both field sites were higher than the concentrations measured inside the truck and those measured in the lab. This was likely due to the fact that styrene is heavier than air and the spot-check readings were taken at the floor level of the truck tailgate each time. UI
ACKNOWLEDGEMENTS
The author acknowledges the research team for this project: Drs. Shaurav Alam, Elizabeth Matthews, and John Kraft, and Quade Wells. TTC also thanks NASSCO for funding this study. The full study report is located on the NASSCO website.
FOR MORE INFORMATION
Trenchless Technology Center, Trenchless Technology Center | Louisiana Tech University (latech.edu)
NASSCO, nassco.org

Comments