
January 2024 Vol. 79 No. 1
Features
CIGMAT focuses on challenging research, technology transfer, information sharing
Established in 1984, at the University of Houston, the Center for Innovative Grouting Materials and Technology (CIGMAT) is dedicated to fostering improved understanding of grouting materials and their applications.
A major way it achieves this is by conducting [and participating in] highly challenging research [aimed at finding (grouting) solutions for construction, rehabilitation and environmental problems} to develop innovative grouting materials and improve current grouting technology. Research will be conducted which will directly impact the development of grouting technology.
Since 1994, the director of CIGMAT has been Cumaraswamy Vipulanandan (Vipu), P.E., Ph.D., professor of Civil Engineering at the University of Houston, and director of the Texas Hurricane Center for Innovative Technology (THC-IT).
With an integrated, interdisciplinary framework, CIGMAT draws on University of Houston expertise in engineering, science and technology. It’s also a joint university-industry consortium, with research funded by and/or collaborated with federal, state, and local agencies and regulators, and practitioners from the various industries served, such as coatings, grouts, construction, pipes and oil.
In recent years, research has focused on real-time monitoring of mixing materials, such as cement, concrete, drilling muds and grouts; various critical processes during construction; and the entire service life of various infrastructures. Studies have also included the recycling of wastewater, plastics and waste materials; and treating of contaminated soils.
CIGMAT also works closely with THC-IT, related to disaster management and rapid recovery. Recent natural and human-made disasters, such as cyber-attacks and the COVID-19 pandemic, have greatly impacted the construction industries. Based on the lessons learned, future plans are being developed to minimize the losses.
This research involves developing new, highly sensing “smart” materials that are integrated with real-time monitoring and wireless transferring for construction, maintenance, repairs and detecting gas, oil and water leaks.
Many studies are focused on monitoring field performances (smart cemented well, bridges supported on deep foundations), developing and characterizing “smart” materials (cements, grouts and drilling muds) for oil well and water well construction and cementing, ultra deepwater pipe-soil interaction, joint leak testing of stormwater pipes, detection and quantification of corrosion, and application of nanotechnology.
Research is also being done on further developing the highly sensing smart cement, smart drilling fluids, smart spacer fluids and smart grouts for various applications, evaluating performance of smart grouted sand columns for monitoring earth embankments, failure theory for rocks, smart cement contaminated with clay, developing methods to treat contaminated soils and expansive clays, and multifunctional microbial fuel cells to treat various types of wastewaters with the production of electricity and valuable byproducts.
Another priority of CIGMAT researchers is making every effort to transfer technology from control studies to actual applications.
In the past two decades, over five dozen commercial products, including rapid repair materials, coatings, grouts, liners, cementitious, and polymer composites and pipes, have been researched and tested for a number of applications. Microbial fuel cell technology is being further developed to treat both oily waste and recycle highly salty fracturing fluids.
Also, the observed trends are analytically and numerically modeled to better understand the influence of various types of organic and inorganic contaminants and environmental parameters with the field operating conditions.
A unique strength is CIGMAT’s access to and development of testing facilities and equipment, not generally available in the area of grouts and grout applications.
Examples of CIGMAT developments include high-pressure and high-temperature (HPHT) testing materials for oil and gas infrastructure applications, and EPA-approved protocols to test grouts and coatings for infrastructure rehabilitations. The Life Cycle Cost model, for wastewater systems, posted on the CIGMAT website, is being used by cities, counties and the public.
Other models – Curing, Rheological, Failure, Fluid Flow, Fluid Loss – all developed by Vipulanandan, are being verified with CIGMAT test results and data. They are also being used around the world, based on citations listed in Google Scholar and Web of Science. They are also compared to Artificial Neural network (ANN) and Artificial Intelligent (AI) predictive models.
The following are two examples that highlight the depth of breadth of CIGMAT research areas, methods, materials, and development and application of Vipulanandan models.
Curing, Compressive Piezoresistive Behavior of Concrete with Smart Cement Binder
During the past 200 years, cement and concrete have been widely used in many applications that have been well-documented.
Cement slurries and grouts, based on the water-to-cement (w/c) ratio, have been used in the construction of shallow and deep oil, gas and water wells both onshore and offshore. These materials are used to bond the pipes to the formation in horizontal directional drilling, bond the steel casings and pipes to the varying geological formations in the wellbore, and to isolate the formations.
In the well application, cement bonds have to be strong, with the highly varying natural geological formations and depth, and to the human-made steel casing and pipes. The bonds also have to perform for many decades under varying loading conditions, temperatures, pressures and seismic activities. Hence, it is important to monitor the cement, from the time of mixing through the entire service life in-situ.
There have been many concrete bridges, highways, dams, buildings, storage facilities, foundations and pipes that have failed over the past 100 years due to loadings, earthquakes, fires and aging. Failures can result in many types of losses and impact the economy, so there is a need for real-time monitoring of the changing conditions, through the entire service life of the infrastructures, to eliminate failures.
Concrete is a very popular construction material and has been used for over 2,000 years. Concrete with high aggregate content, in a binding agent, can be used in the construction of very small to very large structures such as bricks, roads, houses, bridges, pipes, dams, canals, storage, missile silos and nuclear waste containment.
To attain the required levels of safety and durability of such structures, mixing proportions and, especially, aggregate content must be adjusted according to application in order to achieve mechanical requirements that will significantly affect the performance during its life time.
In preparing the concrete and cement slurries, the w/c ratios have been varied from 0.38 to 0.6 based on the mixing method, constituents of the concrete mix and applications.
Many different testing techniques exist, such as ultrasound, fiber optic, electronic microscopy, X-ray diffraction, thermography and vibro-thermography, to study the aging of cement composites and for damage detection. However, many of these methods are difficult to adopt under field conditions, where accessibility becomes an issue in deep foundations, buried storage facilities, wells, dams, tunnels and pipes.
Concrete is composed of cement, aggregates, water and additives, based on the application. The most essential constituent is cement, as it helps in the binding of the aggregates. The additives and water enhance its performance.
Immediately after mixing, the concrete quality is determined using the flow cone method, which has existed for more than nine decades. There is a need for better characterization of concrete using material properties that must be easy to adopt in the field.
Cement is the largest quantity of material manufactured in the world – 4.2 trillion tons in 2017 – and has many applications.
Chemo-thermo-piezoresistive “smart cement,” invented by Dr. Vipulanandan (U.S. Patent 10,481,143; 2019) can sense and monitor, in real-time, the many changes happening inside the cement during cementing of wells, to concreting of various infrastructure, to the entire service life of the structures.
Smart cement is the binder that can sense the changes in cement in w/c ratios, different additives, contamination and pressure applied to the cement sheath or concrete, in terms of chemo-thermo-piezoresistivity. The failure compressive strain for the smart cement was 0.2 percent at peak compressive stress, and the resistivity change is over 500 times more sensitive.
The overall objective of this study was to highlight the potential use of the highly sensing smart cement integrated with real-time monitoring in new and in-service infrastructures.
Specific objectives were as follows:
- Test the curing and piezoresistive behavior of concrete with smart cement binder
- Model the curing using Vipulanandan Curing Model.
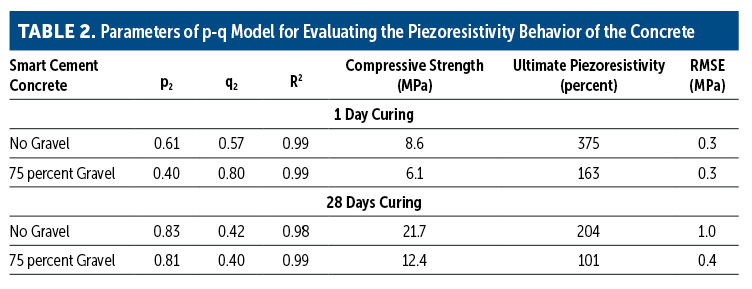
- Model the piezoresistive behavior of the concrete using Vipulanandan p-q Stress- Piezoresistive Strain Model.
Materials & methods
Smart-cement concrete specimens were prepared, in tabletop blenders, using smart (sensing) cement (mixed with less than 0.1 percent carbon fibers, based on cement weight) with water-cement ratio of 0.38.
Concrete specimens were prepared using 75 percent coarse aggregates based on the total volume of concrete. Sieve analysis (ASTM C136) was performed to determine the gradation of aggregate and the gradation. The median diameter, which also represents d50 (ASTM), was 50 percent of the particles less than 4.2 mm.
After mixing, the concrete was placed in 100-mm height by 50-mm diameter cylindrical molds, with two conductive flexible wires 1-mm in diameter (representing the probes) placed 50 mm apart, vertically, to measure the electrical resistance. The specimens were cured up to 28 days under 90 percent relative humidity.
At least three specimens were tested under each condition; average values are presented in the figures, tables and discussion, below.
Two different devices were used to measure the changes in the electrical resistivity of concrete and grout immediately after mixing, up to the time they solidify. Both devices were calibrated using the standard solutions of sodium chloride (NaCl).
A commercially available conductivity meter was used to measure the conductivity (inverse of electrical resistivity). The conductivity measuring range was from 0.1μS/cm to 1000 mS/cm, representing a resistivity of 100,000 Ω.m. to 0.01 Ω.m., respectively.
The digital resistivity meter measured the resistivity in the range of 0.01Ω-m to 400 Ω-m.
An LCR – inductance (L), capacitance (C), and resistance (R) – meter was used to monitor the electrical resistance of the specimens during the curing time. The two-wire method, with AC at 300 kHz frequency, was used in order to minimize the contact resistances.
During the initial stage of curing, both the electrical resistivity (ρ) and electrical resistance (R) were measured to determine Parameters K and G, based on Eqn. (1). This new equation, relating resistivity (ρ) to resistance (R), was developed at CIGMAT based on past experience and test results for conductive (metals), semi-conductive (cement, concrete) and non-conductive materials:
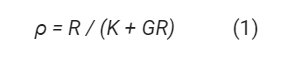
In this study, electrical resistance (R) and electrical resistivity ([Equation]) were measured independently during the initial curing period. The effective calibration factors (K and G) for the materials used in this study (semi-conductive) were determined experimentally. For the smart cement and concrete, Parameter G = 0 and Parameter K became stable (constant) in two to three hours.
Parameter K was more than double the nominal Parameter Kn equal to L/A, where L is the spacing between the measuring wires and A is the cross section for the specimens tested.
Normalized change in resistivity [Equation] , with the changing conditions can be represented as follows (Eqn. (2))

The smart cement material is represented in terms of resistivity (ρ) and the changes due to stress will be quantified to evaluate the sensitivity of the material.
Change in resistance was measured using the two-probe method with the LCR meter, at 300 kHz. This configuration was first calibrated using the same liquid (cement slurry) to determine Parameter K in Eqn. (1).
The cylindrical specimens (concrete, cement and grout) were capped and tested at a predetermined controlled displacement rate of 0.125 mm per minute. Tests were performed with the Tinious Olsun machine to measure the strain, and a commercially available extensometer (accuracy of 0.001 percent strain) was used.
During the compression test, the change in resistance was measured continuously using the LCR meter. The two-probe method, with alternative current (AC) at 300 kHz frequency, was used to minimize the contact resistances. The change in resistance was monitored, and the relationship in Eqn. (2) was used to relate the changes in resistivity to the applied stress.
Modeling
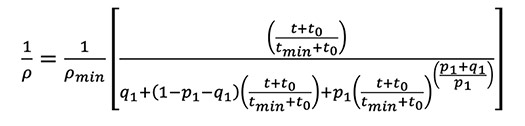
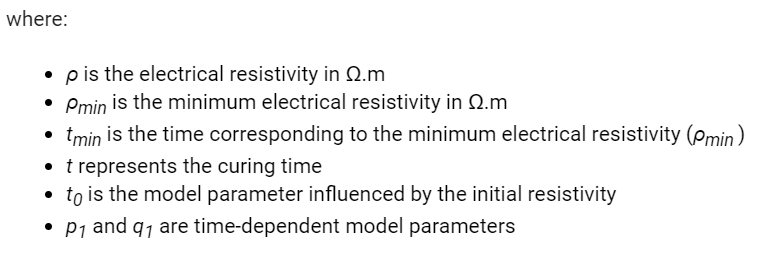
To represent the electrical resistivity development of the cement, the Vipulanandan Curing model was used. The relationship is as follows:
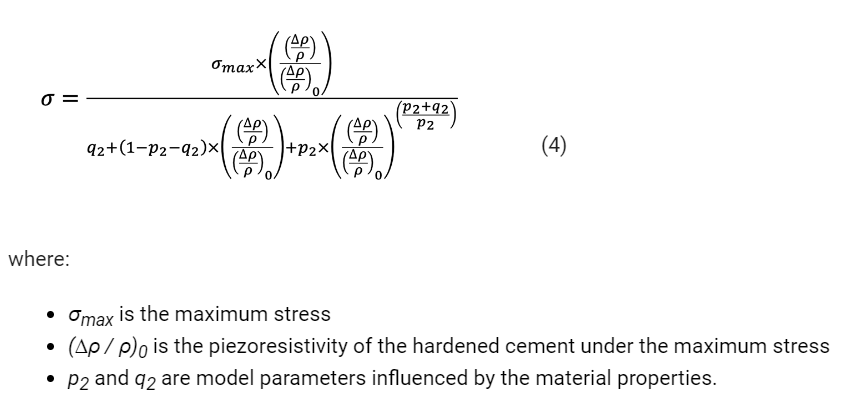
To represent the piezoresistive behavior of the hardened cement, the Vipulanandan Piezoresistivity Model was used. The relationship is as follows:
It is important to first characterize the materials based on the electrical properties, which can be easily adopted and used for monitoring in the field.
Two studies investigated different possible equivalent circuits for cement and concrete, with the two-probe measurements, using the new Vipulanandan Impedance Model.
In Case 1, General Bulk Material-Capacitance and Resistance, the contacts were connected in series, and both the contacts and bulk material were represented using a capacitor and a resistor connected in parallel. Rb and Cb are resistance and capacitance of the bulk material, respectively; Rc and Cc are resistance and capacitance of the contacts, respectively.
Both contacts are represented with the same resistance (Rc) and capacitance (Cc), as they are identical. Total impedance of the equivalent circuit for Case 1 (Z1) can be represented as:
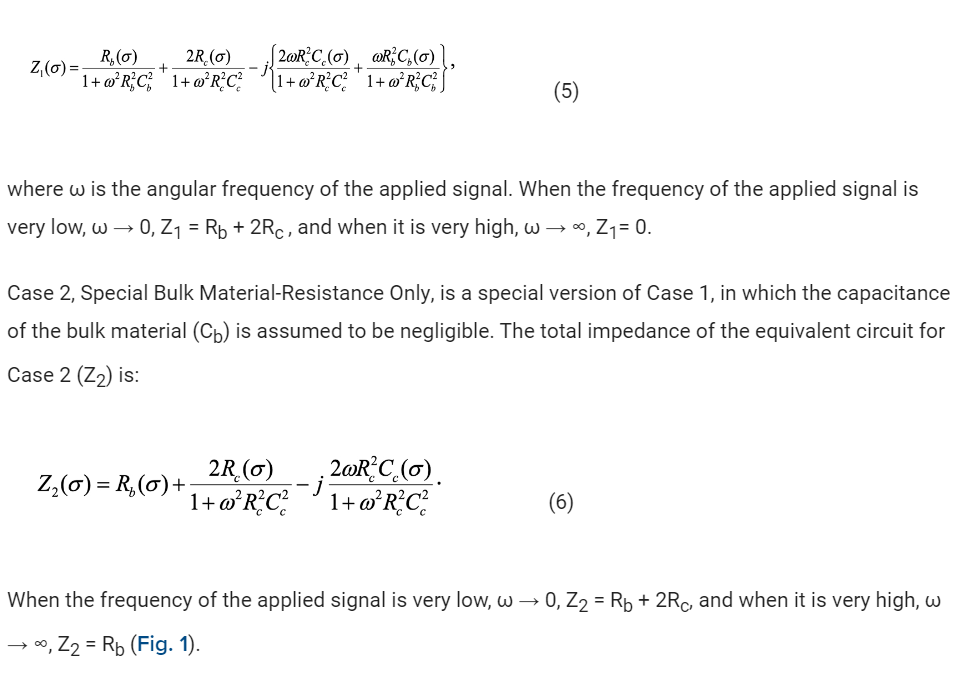
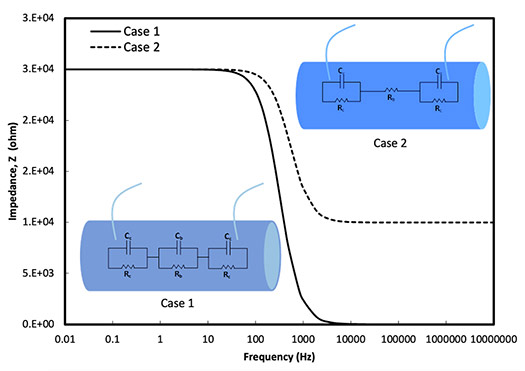
The shape of the curves shown in Figure 1 is very much influenced by the material response and the two probes used for monitoring. Testing of smart cement and concrete indicated that Case 2 represented their behaviors and, hence, the bulk material properties can be represented by resistivity and characterized at a frequency of 300 kHz using the two probes.
Results and Analyses
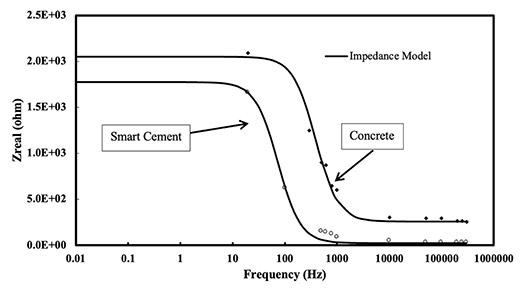
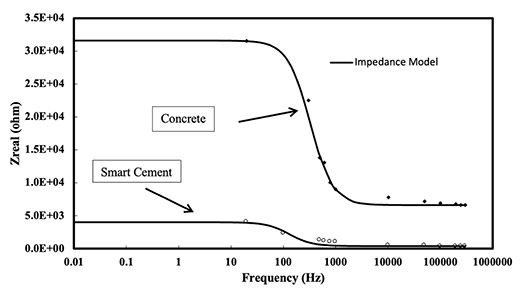
Investigation of the impedance-versus-frequency relationship, tested immediately after mixing and after 28 days of curing, for the smart cement grout and smart cement concrete, is shown in Figures 2 and 3. The observed shape of the curve represents Case 2, indicating that the bulk material can be represented by resistance. This has been verified for over 5 years.
Initial electrical resistivity increased with the addition of aggregates. Average initial electrical resistivity of the smart cement was 1.02 Ω.m. Average initial electrical resistivity of the smart cement concrete, with 75 percent gravel, increased by 267 percent, to 3.74 Ω.m. This was due to gravel content in the concrete.
Electrical resistivity of concrete is determined mainly by the porosity and conductive ion concentration in the pore solution. From the standpoint of conductivity, concrete can be regarded as a two-component composite material: pore solution and solid phase (aggregate + hydration products + unhydrated binders).
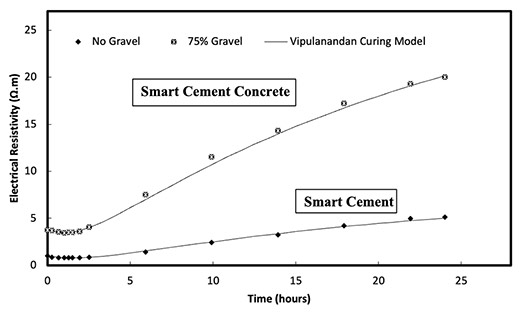
During the setting of the cement, the capillary porosity is constant; changes in the pore solution resistivity lead to determining the evolution of the slurry resistivity. As shown in Figure 4, the cement and concrete resistivity decreased initially and reached a minimum resistivity of [Equation] at the specific time of [Equation].
This is due to increments of ionic concentration in pore solution. By preceding the hydration, production of C-S-H network caused later increment in bulk paste resistivity.
The minimum electrical resistivity of the smart cement after 90 minutes of mixing was 0.79 Ω.m (Table 1, Figure 4).
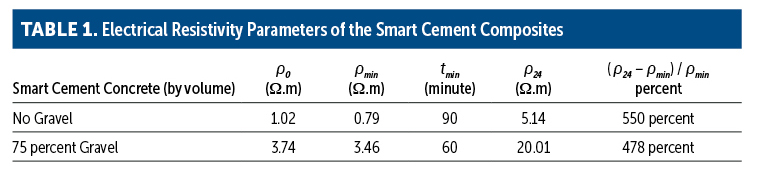
Minimum electrical resistivity of the 75 percent gravel smart cement concrete increased by 339 percent, to 3.46 Ω.m. The time corresponds to the minimum resistivity of 75 percent gravel smart cement concrete, reduced by 30 minutes to 60 minutes, compared to the smart cement.
After 28 days of curing:
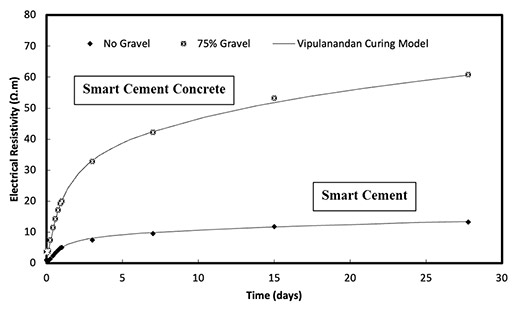
- Electrical resistivity of smart cement was 14.14 Ω.m. (Fig. 5).
- Electrical resistivity of 75 percent gravel smart cement composite increased by 333 percent, to 61.24 Ω.m.
Compressive strength of smart cement and smart concrete was tested at two intervals.
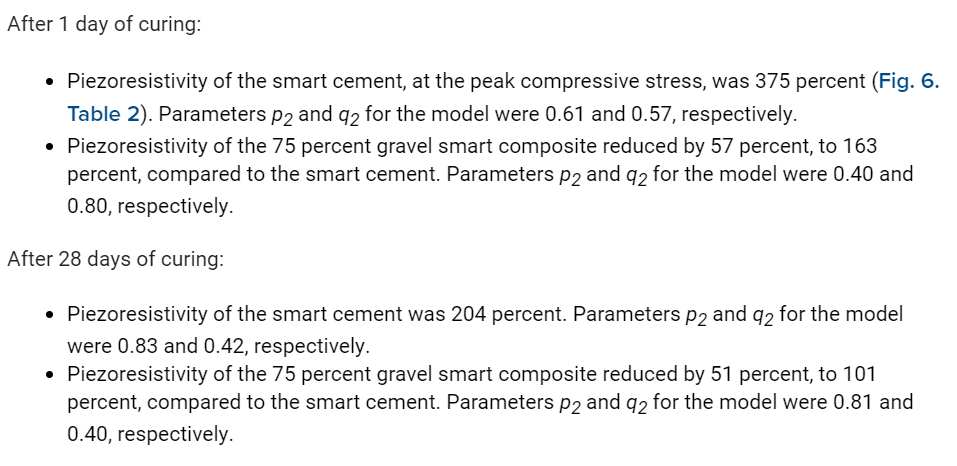
After 1 day of curing:
- Compressive strength of the smart cement was 8.6 MPa.
- Compressive strength of the 75 percent gravel smart composite decreased by 29 percent, to 6.1 MPa, compared to the smart cement with no gravel.
After 28 days of curing:
- Compressive strength of the smart cement was 21.7 MPa.
- Compressive strength of the 75 percent gravel concrete decreased by 43 percent, to 12.4 MPa, compared to the smart cement with no gravel
Changes in compressive strength of the concrete can be justified with the percentage of cement in the concrete.
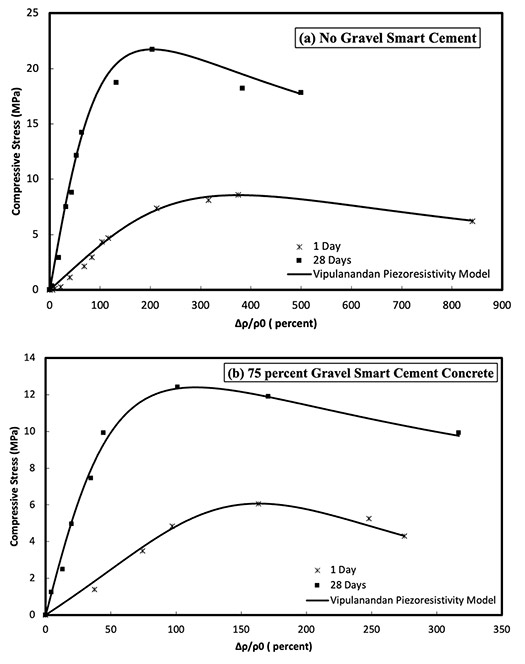
Piezoresistive behavior was evaluated after the same two time periods, as shown in Figure 6.
Conclusions
Smart cement was used as the binder in the concrete to make it highly bulk sensing. It is also important to develop real-time monitoring systems that can be easily adopted in the field.
Based on experimental and analytical study on the behavior of smart concrete (with smart cement binder), with real-time monitoring in the field, the following conclusions are advanced:
- Addition of coarse aggregate increased the initial electrical resistivity of the smart cement composite, as well as long-term electrical resistivity during curing. The initial electrical resistivity of smart cement was 1.02 Ω.m, which increased to 3.74 Ω.m. with 75 percent gravel, respectively. After 28-day curing, the electrical resistivity of smart cement was 14.14 Ω.m, which increased to 61.24 Ω.m, with 75 percent gravel respectively.
Also, the Vipulanandan Curing Model predicted the electrical resistivity development in the concrete very well.
- Piezoresistivity of the smart cement with 0 percent and 75 percent gravel content, after 28 days of curing, was 204 percent and 101 percent, respectively, at a peak compressive stress.
The Vipulanandan Piezoresistivity Model can be used to predict the piezoresistivity behavior of the smart cement concrete very well.
- Failure strain of concrete is 0.3 percent; hence, piezoresistive concrete has magnified the monitoring resistivity parameter by 336 times (33,600 percent) or more, based on the aggregate content, making the concrete a bulk sensor.
- The Vipulanandan Curing Model and Vipulanandan p-q Stress-Piezoresistive Strain Model predicted the concrete with smart cement binder behavior very well.
Vipulanandan Rheological Model Characterizes the Effects of Water-to-Cement Ratios on the Rheological Properties of Cement Grouts Modified with Clay
Cement grouts are used in multiple applications, such as stabilizing soils, repairing various damaged infrastructures, installing wells, and solidification of contaminated soils. In all these cases, cement grouts have to be injected at varying pressures to flow through complex macro and microstructures; hence, the cement grout’s rheological properties become very important.
One of the major variables for the cement grout is the water-to-cement (w/c) ratio. Also, for some applications, cement grouts are modified by adding clay, which will also impact the rheological properties.
For structural construction, cement grouts are used in the ducts of post-tensioned beams. The beams’ long-term performance very much depends on the durability of the injected grouts to bond the concrete to the post-tensioned steel reinforcements and to transfer the loads. Cement grouts are used in cementing oil, gas and water wells, which are expected to be productive for decades. Cement grouts are also used for repairing these wells and in CO2 sequestration wells.
Cement grouts are used in repairing beams, pipelines and underground storage facilities in-situ. The success of these operations also depends on the durability and long-term strength of the cement grouts.
Cement grouts are used in stabilizing the soils to strength them for multiple applications. Hence, there is an increasing interest in understanding and quantifying not only the variation of strength with curing time, but also the long-term stress-strain behavior of the cement grouts.
For grouting applications, modifiers such as various types of clay (metakaolin, bentonite) ashes, silica fume and cement kiln dust, have been used. Modifiers containing reactive minerals with the cement grout change the hardening process and flow properties of cementitious grouts.
Using metakaolin clay (MK) as a cement replacement material (up to 30 percent), leads to microstructure modification. This protects against aggressive action of organic acids and diffusion of harmful ions that can cause degradation of the cement matrix. Also, to reduce the impact on the environment, clays have been used to partially replace the cementitious materials.
During the cement hydration process, water reacts with the cement and produces calcium-silicate-hydrate and calcium hydroxide. Calcium hydroxide (Ca(OH)2) is considered the weak-linking cement and, hence, reduces the effect of the calcium silicate hydrate. When clay, aluminum silicate is added, it reacts with the Ca(OH)2 in the hydrating cement to form additional calcium silicate hydrate material, making the cement grout stronger and more durable.
The amount of water added to the cement grouts gives it the ability to be pumped into porous soils and fractured concrete. In general, groutability increases with the addition of water, but results in decreased strength and longer setting times. Thus, the long-term durability of the grouts with higher w/c ratio must be investigated.
To describe the behavior of various types of fluids, such as grouts and drilling fluids, the Herschel-Bulkley Model has been used for decades to estimate the flow properties.
Developed in 1926, Herschel-Bulkley has been used to predict the shear-thinning and shear-thickening behaviors of various types of slurries. The Vipulanandan Rheological Model that was developed in 2014 for all types of fluids (shear thinning, shear thickening and Newtonian) has been used to characterize shear-thinning behavior of drilling muds and oil well cement slurries.
In addition, the Vipulanandan Rheological relationship for shear-thinning fluids limits the magnitude of the shear-stress tolerance of drilling mud. However, all the other relationships that predicted infinite sheer-stress tolerance for the drilling mud have clearly stated that of several rheological models, the Vipulanandan Rheological Model better predicted the test results.
The focus of this study was to test and quantify the addition of metakaoline (MK) clay and w/c ratio on the rheological properties of the cement grouts. The specific focus of the study was as follows:
- Quantify the rheological properties of cement grouts modified with clay (MK) and w/c ratios.
- Model the rheological properties of cement grouts with and without clay, and also verify the models.
Models
The cement grouts showed that the rate of increase in the shear stress (t) decreased with the increase in shear strain rate () (tangent viscosity), representing a shear-thinning fluid. It is important to satisfy the observed test results with the constitutive model.
Some of the observed conditions for cement slurries are:
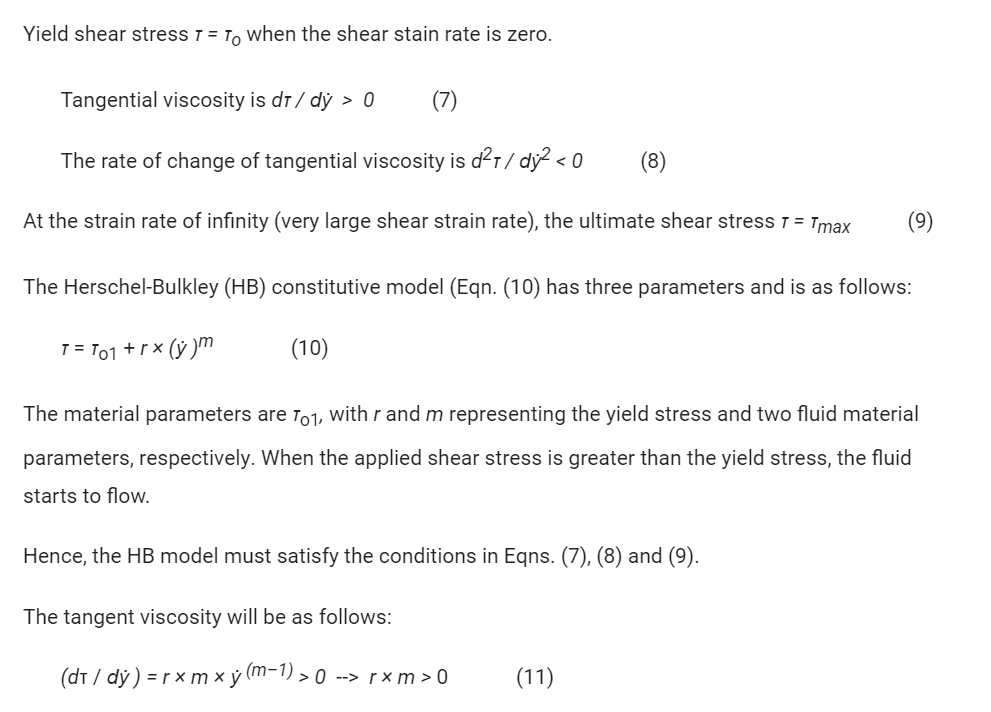
The rate of change of tangent viscosity is as follows:
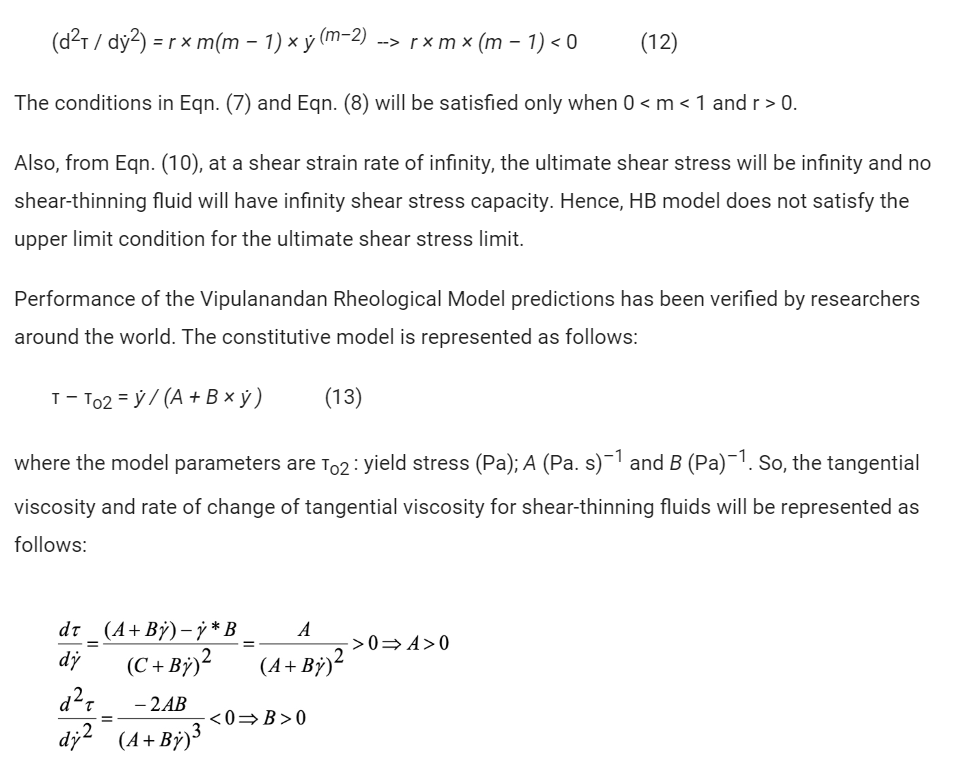
Also, when the shear stain rate reaches infinity, the ultimate shear strength:

Therefore, Eqn. (13) has a limit to the fluid shear stress tolerance representing the ultimate shear strength of the fluid.
Materials and methods
Portland cement (Type 1) (ASTM C 150 -16) was used in preparing the grouts.
Commercially available metakaolin (MK) clay, at different percentages, up to 10 percent (by the weight of dry cement), was added to cement.
The cement grouts with and without MK were tested using a rheometer with varying speed. The speed accuracy of this device was 0.001 rpm. A standard solution with a viscosity of 100 cP was used to calibrate the instrument.
All the rheological tests were performed after 10 minutes of mixing the cement grouts. For all the tests, at least three samples were tested for each condition.
Results and Discussion
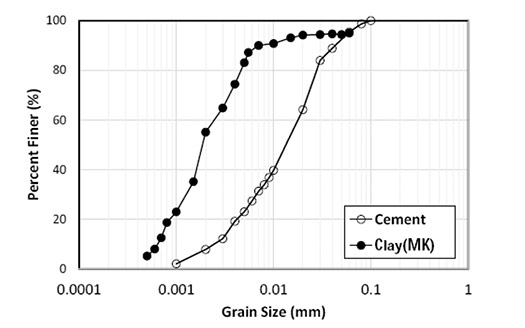
In Fig.7, the grain size distribution of clay (MK), using the hydrometer method (ASTM D 422-07), is compared to the cement. The d50 of 1.9 mm was over 10 times finer than the cement. The coefficient of uniformity (Cu) for the clay was 3.68.
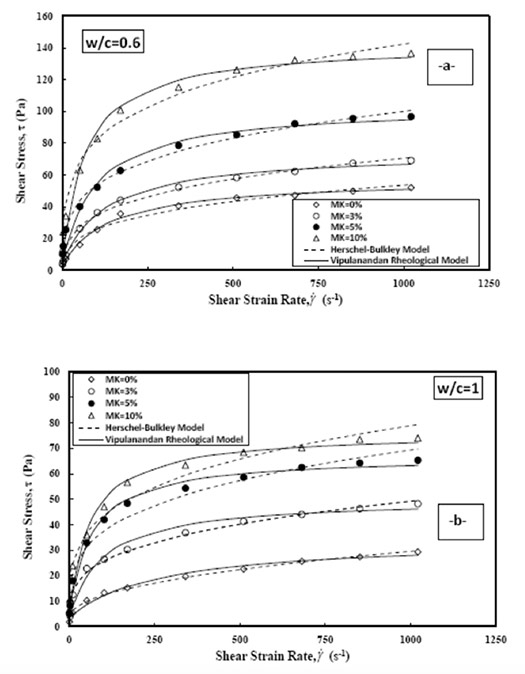
Cement grouts investigated in this study, with 10 percent clay (MK) content, showed different rheological properties. All the tested grouts showed non-Newtonian shear-thinning behavior, as shown in Fig. 8.
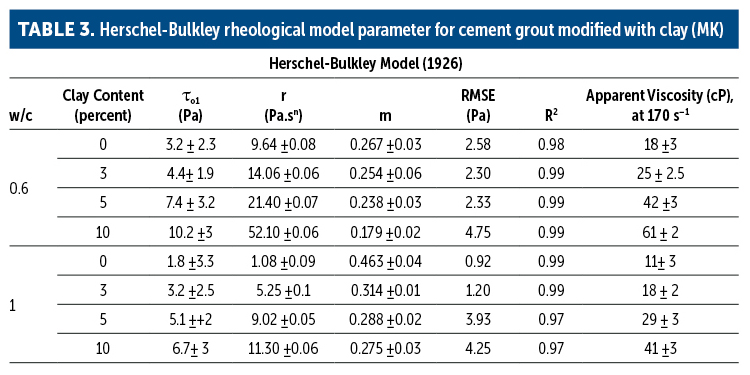
Adding water to the grout reduced the apparent viscosity (secant viscosity) of the cement grouts. Apparent viscosity of the cement grouts with w/c ratio of 0.6 and 1.0 without clay (MK), at a shear strain rate of 170 s-1 (100 rpm, at room temperature), was 18 cP and 11 cP, respectively, as summarized in Table 3.
Adding 10 percent of clay (MK) to the cement grout increased the apparent viscosity, with w/c ratio of 0.6 and 1, at a shear strain rate of 170 s-1, from 18 cP to 61 cP and from 11 cP to 41 cP, respectively, as summarized in Table 3.
The constitutive relationships for cement grouts with various w/c ratios and different clay (MK) content are shown in Fig. 8.
Reducing the w/c ratio increased the shear stress at the same shear-strain rates, which indicates lower flow properties of the cement grout. Also, adding clay (MK) increased yield stress and the apparent viscosity at the same shear-strain rates and w/c ratio, as shown in Fig. 8.
The behavior of cement grouts with varying clay (MK) and w/c ratios was predicted using the Vipulanandan Rheological relationship and compared with the Herschel-Bulkley relationship, as shown in Fig. 8.
Herschel-Bulkley model
The behavior of cement grouts (o.6 w/c ratio) at different percentages of clay (MK) were modeled using the HB model (Eqn. (10) up to a shear-strain rate of 1024 s-1 (600 rpm). The co-efficients of determination (R2) varied between 0.98 and 0.99 (Table 3).
The root mean square of error (RMSE) for cement grout slurry at 0 percent and 10 percent of clay (MK) was 2.58 Pa and 4.75 Pa, respectively (Table 3). The addition of 10 percent clay (MK) to the cement grout with w/c ratio of 0.6, increased the yield stress (to1) from 3.2 Pa to 10.2 Pa – a 219 percent increase (Table 3).
Parameter k for the cement grout with w/c ratio of 0.6 at 0 percent and 10 percent of clay (MK) was 9.64 Pa.sn and 52.10 Pa.sn, respectively (Table 3). Parameter m for the cement grout slurry with w/c ratio of 0.6 with 0 percent and 10 percent of clay (MK) was 0.267 Pa.sn and 0.179 Pa.sn, respectively (Table 3).
The behavior of w/c ration 1.0 cement grout with different percentages of clay (MK) was modeled using HB (Eqn. (10)).
The R2 varied between 0.97 and 0.99 (Table 3). The RMSE for cement grout modified with 0 percent and 10 percent of clay (MK) was 0.92 Pa and 4.25 Pa, respectively (Table 3).
The yield stress (to1) for the cement grout with 0 percent clay (MK) was 1.8 Pa and increased to 6.7 Pa when increasing the clay (MK) to 10 percent - an increase of 272 percent - and the trend was similar to what was observed with 0.6 w/c ratio.
Parameter k for the cement grout with w/c ratio of 1.0 at 0 percent and 10 percent of clay (MK) was 1.08 Pa.sn and 11.3 Pa.sn, respectively (Table 3). Parameter m for the w/c ration 1.0 cement grout with 0 percent and 10 percent of clay (MK) was 0.463 Pa.sn and 0.275 Pa.sn, respectively (Table 3).
Vipulanandan Rheological Model
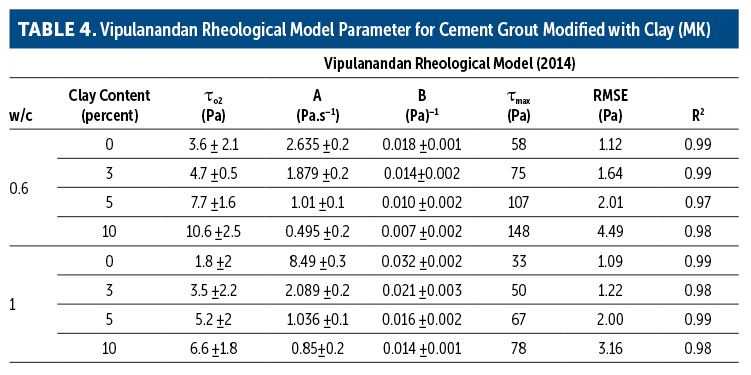
The performance of the o.6 w/c ratio cement grout with different percentages of clay (MK) was modeled using the Vipulanandan Rheological Model (Eqn. (13)). The R2 varied between 0.97 and 0.99 (Table 4).
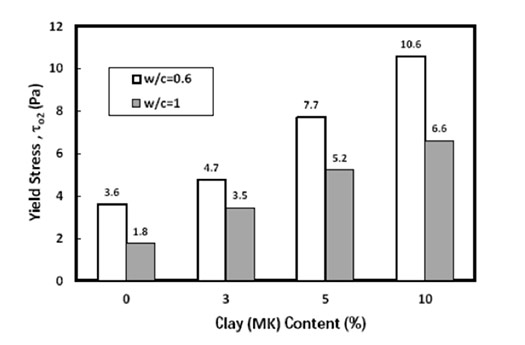
RMSE for the cement grout modified with 0 percent and 10 percent clay (MK) was 1.12 Pa and 4.49 Pa, respectively (Table 4). The yield stress (to2) for the cement grout with 0 percent clay (MK) was 3.6 Pa and increased to 10.6 Pa when the clay (MK) content increased to 10 percent - a 94 percent increase (Table 4).
Parameter A for the cement grout with 0 percent and 10 percent clay (MK) was 2.635 Pa.s-1and 0.495Pa.s-1 respectively – an 81 percent reduction. The model parameter B for the cement grout with 0 percent and 10 percent clay (MK) was 0.018 Pa -1 and 0.007 Pa-1, respectively, a 61 percent reduction (Table 4).
The performance of the cement grout slurry with w/c ratio of 1.0 at different percentages of clay (MK), with w/c ratio of 1.0, was modeled using the Vipulanandan Rheological Model (Eqn. (13) and Fig. 8).
The coefficients of determination (R2) varied between 0.98 and 0.99 (Table 4). RMSE for the cement grout modified with 0 percent and 10 percent clay (MK) was 1.09 Pa and 3.16 Pa, respectively (Table 4).
The yield stress (to2) for the cement grout slurry with 0 percent of clay (MK) was 1.8 Pa and increased to 6.6 Pa when the clay (MK) increased to 10 percent - a 267 percent increase – as shown in Fig. 8 and summarized in Table 4.
Parameter A for the cement grout slurry with 0 percent and 10 percent clay (MK) was 8.49 Pa.s-1 and 0.85 Pa.s-1, respectively, a 90 percent reduction. The B Parameter was 0.032 Pa -1 and 0.014 Pa-1, respectively, a 56 percent reduction (Table 4).
Based on the rheological model prediction of the test results, Vipulanandan Rheological Model was used to determine the yield stresses for grout mixes. Reducing the w/c ratio increased the yield shear stress, which indicates lower flow properties, as shown in Fig. 9. Increasing the w/c ratio 0.6 to 1.0, reduced the yield stress from 3.6 Pa to 1.8 Pa – a 50 percent drop.
Adding clay (MK) increased yield stress, as shown in Fig. 9. With w/c ratio of 0.6, adding 10 percent clay increased the yield stress from 3.6 Pa to 10.6 Pa – almost tripled. With the w/c ratio of 1.0, addition of 10 percent clay increased the yield stress from 1.8 Pa to 6.6 Pa – 3.5 times more.
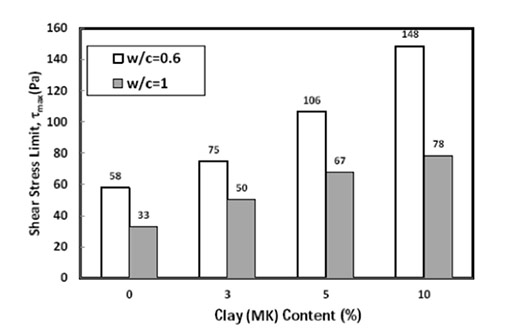
Based on the Vipulanandan Rheological Model, there is a limit on the maximum shear stress (tmax.) for the cement grouts at the relatively high rate of shear strains.
The tmax for the cement grout slurries with w/c ratio of 0.6 and 1 at 0 percent and 10 percent of clay (MK) was 58 Pa, 148 Pa and 33 Pa, 78 Pa, respectively, as shown in Fig. 10 and summarized in Table 4. The addition of 10 percent clay (MK) to the cement grouts increased the ultimate shear strength by 160 percent and 144 percent for w/c ratio of 0.6 and 1, respectively (Table 4).
Conclusions
Based on the experimental and analytical modeling of the rheological properties of cement grouts, with w/c ratios of 0.6 and 1.0, and modified with up to 10 percent clay (MK), the following conclusions are advanced:
- Rheological tests showed that the cement grouts with and without up to 10 percent clay additive had shear-thinning behavior.
- Vipulanandan Rheological Model was used to predict shear stress/shear strain rate relationship and predicted the test results very well, compared to the Herschel-Bulkley model based on root-mean square error.
- The yield stress and maximum shear stress limit reduced with an increase in w/c ratio, while adding the clay (MK) increased these two properties, which were quantified using the Vipulanandan Rheological Model.
Education, Information
In addition to conducting research, CIGMAT strives to function as an informational and educational resource on grouts and their applications for a variety of industry, government and municipal groups; engineers and university students.
It is a networking center in which information about innovative techniques, models data analytics, operations and maintenance for critical infrastructure is shared with the technical community, and advisory services respond to requests to improve specific areas of grouting interests.
Education is provided through an annual conference, by presenting papers and posters at national and international conferences and including critical subjects in undergraduate and graduate courses.
Its Conference and Exhibition, held each year on the first Friday in March, is titled "Infrastructures, Energy, Geotechnical, Flooding and Sustainability Issues Related to Houston and Other Major Cities.”
Speakers are invited from major cities, transportation authorities and energy industries around the country to present and discuss projects and problems related to construction, maintenance and rehabilitation issues.
The well-attended conference also discusses technical issues related to maintenance and rehabilitation of water and wastewater systems, nondestructive testing methods, oil wells and pipelines, hydraulic fracturing and development of smart materials for various applications. A number of geotechnical topics related to expansive clays, rapid construction of deep foundations and ground faulting are also discussed.
Proceedings of the past 23 years of conferences are posted on the CIGMAT website.
In 2024, the conference will take place on March 1, at the University of Houston Hilton Hotel.

Comments